Electrical prefabrication within BIM
Introduction
For the last few years I’ve been working in the electrical prefabrication environment on a specific task: automatic spool-sheet and shop drawing generation, packaging labels printing, the as-built assembly time tracking tool, the estimating tool and the overall improvement of communication between the shop team and design team. This article discovers a tech stack to maximize BIM value. I will share the main understanding of building data and demonstrate what can be accomplished to boost productivity and profitability of your design and prefabrication teams without Autodesk cloud solutions.
Electrical Prefabrication with BIM Overview
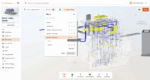
Prefabrication is a technique that divides complex electrical installations into manageable subassemblies that can be prefabricated off site: wall roughing, light fixtures, standalone transformer wiring, overhead and underground conduits and a lot more. So the design team works towards a Universal process that reduces time, reduces and eventually eliminates paper and provides an accurate and easy to use document to create and assemble in the Pre-Fab shop as well as in the field. The team are working on three-dimensional documents, and has the ability to generate detailed views and minimize the number of assemblies of prefabricated elements.
This is what we found out: “Build data to do prefabrication”. Revit works as the graphical support of a project, database — informational. Layout (outlets placement) in Revit, families should have “room calculation point” so every item gets associated with room number. Tagging is also faster within Revit. All of the outlets need to be placed on the correct elevation not only to have a section view, but for the wire calculation purposes.
Before you start
Obviously, we are going to have a lot of parameters to identify a specific element in a project, and there are all different types: text, numbers, calculations, long text (as an example, wall rough — 120 parameters). A prefabricated power product line includes brackets, boxes, plaster ring device covers, harnesses attached to devices, panels, j-boxes, struts and so on and so forth.
Communication between modelers and a construction site can be improved by revising shop drawings. But when we are talking about paperless workflow, time tracking, and displaying charts you need to get away from MS Excel spreadsheets, even with its import/export functionality. There is a Developer mode which allows scripting but the same file wouldn’t work on different computers with different version of MS Office. On top of that, it is impossible to share a file online with scripts attached to it and expect that it’s going to be a multi-platform solution. Coordination, especially — when 3 or more people work on the same project, must not be overlooked. So, no matter how it turns out, basic spreadsheets are inefficient. It’s time to collect data in a simple database.
At this point, it might be smart to ask the question: “What would be the best way to group parameters for future utilization?” or “Which one of those parameters should stay within Revit, CAD or Database”? Complete assemblies, including devices and whips, purchased by contractors who want to benefit from total cost savings offered by prefabrication. Assembly standardization is a key stone at this stage: basic assembly, typical assembly, fully engineered system.
It is widely known that the assemblies depend on the conditions of walls or ceilings (stud size and height, ceiling type, face depth, fireproof, sound proof, waterproof and so on). On the construction site schedules are tight and teams are overstretched. Electrical contractor purchasing practices result in using a range of different vendors for multiple reasons: in-stock inventory, competitive pricing on all bids, Information and education on the latest products and services, creative delivery and pickup options. For this reason, assembly configuration is complicated and time consuming process. Not every box can be installed on any bracket, so we need to find options that work together. We came to the conclusion of using a database as an assembly configurator. That means creating a multitude of table-sources to get information from.
Workflow — The right technology is the catalyst to the design process.
Once you have your database set up and ready to receive parameters from Revit, you can start modeling and laying out engineer design. Make sure that everyone in the team has the same template to start with and the same file of shared basic parameters. Trying to build a database within Revit (keeping everything in a Revit schedule) was not successful for multiple reasons. One of them is different version of Revit. Even if there are a few Dynamo scripts that can help you update your library automatically, they are not as good as you think they are. So we are only getting a few basic parameters from Revit. This becomes a base for the procurement of the project.
Overall there are three types of parameters: base, additional and calculated. The majority of base parameters come from Revit. Additional parameters is a pretty large category, this is the one that helps you configure a final product: part numbers, manufactures, wall condition, tolerance, other project standards. Calculated parameters — final parameters that tie BOM files and reports, these numbers are also go into as-built and shop drawings.
Usually nobody counts flexible wiring lengths — MC cable, flexible conduit. But it is still pretty solid chunk of money when you think about whip scraps in an average project (2ftx$0.3×15000=$9000 minimum). Wiring does not physically exist in Revit in the same way that Cable Tray and Conduit do. There are calculations that determine wire size and length, but those are just numbers. The “Wires” Category refers to the annotative wiring that can be created in a View — again, not as a physically modeled element. If Wires must be illustrated in a 3D model, then the user must create a Family to represent the geometry of the wire. The issue is how much effort/time you are willing to spend to find out the value. There are so many factors that influence the cable lengths. Think about obstructions in the building, regulations (cable separation, min distances, forbidden zones), slack in the cables and so on.
For this reason, the true whip length would be reasonable to count within database environment when you have wall lengths as a standalone parameter. It should be a simple algorithm which solves the track graph. The vertices are traces, and the edges are transitions between points. For trails of structures, the transition was carried out in the place of the closest approach. For pipes — through the beginning and end of the pipe. The diagram is a schematic representation of the graph with vertices V={1,2,3,4,5,6} (which is electrical outlets, or panels, or conduits and so on and so forth) and edges E={{1,2},{1,5},{2,3},{2,5},{3,4},{4,5},{4,6}}. This way it creates a connection list of electrical devices. In addition to this, it is very important to include wall condition as additional parameters which help with the final assembly configuration.
This database ties all pre-construction and construction information together so we can start work on links into Autodesk BIM tools so that contractors can pull quantities from modeled elements of projects and load them into their estimating solutions.
Now we get to the point where there is external processes that require extractions of data from our tables. In some cases the final format must be CSV. Therefore, data from the database needs to be exported into following:
- -> spreadsheets and spoolsheets printing
- -> *.nc files -> CNC machining
- -> *.csv files -> automatic bender
- -> *.csv files -> label print
Rather than manually printing out every item, it is suggested to enter all the settings into a new script file that you can execute in SELECT FROM table in a single command.
It is better to keep all files that have been generated in the same database so you can give it up if needed. With the database we have an opportunity to store links to the documents that have generated out of it. The method of storing just the logical address of the file (in the file system), but we went further and kept files in SharePoint which is storing everything in SQL tables. The documents are stored directly (as blobs/images) in the database.
There are a few exceptionally helpful tools to create a chart report. Power BI is a great tool for data visualization and (some) data transformation, no doubt about it. Over the last few years of its development, it gained many great features and capabilities. You will need to create a dump file of the current database to build a chart off of the data. On the other hand, Google Charts provides a perfect way to visualize data on your website. From simple line charts to complex hierarchical tree maps, the chart gallery provides a large number of ready-to-use chart types. The most common way to use Google Charts is with simple JavaScript that you embed in your web page. You load some Google Chart libraries, list the data to be charted, select options to customize your chart, and finally create a chart object with an id that you choose. Then, later in the web page, you create a <div> with that id to display the Google Chart.
Future opportunities with electrical prefabrication within BIM
I can’t say enough about how important it is to have a good packaging and shipping concept. Even if the entire workflow at the shop is smooth there is still a pretty good chance that you can mess everything up during installation. There are a lot of examples when prefabricated electrical panels have been installed on the third floor instead of on the second. To avoid this situation, do not forget about database we have just created and use it to print out packaging labels.
This workflow is capable of solving a wide range of tasks and therefore is necessary for a modern developer even if it needs some adaptation to the database. Besides updated BOM files, spoolsheets and shop drawings and BIM standards (that you might want to update since you are launching a new workflow) the database would work as a backend — that is accessed by users indirectly through an external application rather than by application programming stored within the database itself or by low level manipulation of the data. Using database for app and web applications (order forms for external customers).
This article was originally published January 31, 2020 on Medium.com. Check out the original post, here!